Carleton University - School of Computer Science Honours Project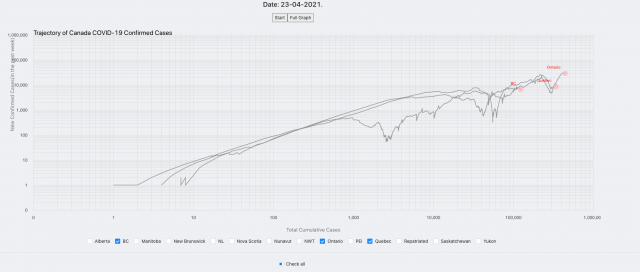
Winter 2021
Data Visualization of Coronavirus in Canada
ABSTRACT
Data visualization is an accessible way to represent the data in a graph and provide insightful
information. This project aims to show the trend of Covid-19 in Canada at the province level and
investigate the effect of government policies on the spread of Coronavirus. Also, the project will
analyze the social media data from Twitter for knowing people's thinking under the impact of
coronavirus pandemic along with the time passed.